 30 | 06 | 2025
 June Top 10 Tech News
June was a big month for tech, with major advancements across space, robotics, AI, energy, and digital services. From reusable …
email-encoder-bundle domain was triggered too early. This is usually an indicator for some code in the plugin or theme running too early. Translations should be loaded at the init action or later. Please see Debugging in WordPress for more information. (This message was added in version 6.7.0.) in /var/www/awg-2024.my-dev.org/wp-includes/functions.php on line 6121 07 | 02 | 2019
 IT innovation has had a tremendous impact on the world of financial operations. Financial Technology or FinTech has become a separate field of IT that works to improve and automate the use and delivery of financial services. The field has become so large that a new FinTech software is released every other day making it very difficult for products to gain a stable position on the market.
Thus, having a long experience in this industry and a very promising idea for data mining, a large English FinTech company decided not to risk providing a hasty solution built using some off-the-shelf technologies. Instead, it engaged Agiliway experts to develop a complex, stable and scalable BI solution that would be flexible enough to cater to the needs of various users and thus, ensure sustainable growth for the company. Join our discussion of the case to find out details of the developed solution.
The FinTech company had a long background of cooperation with large banks. In particular, the company helped financial institutions monitor how various departments and employees use documents and statistics in the decision-making process. Such services have great value for banks allowing them to assess the effectiveness of the staff and to make informed decisions in what sources of information to invest.
Considering the demand for the services, the FinTech company wanted to develop a stable, reliable and scalable BI solution that would present the information on the flow and usage of data in the convenient for data mining way. It was planned to further market the solution as a SaaS.
The major demands to the solution were
Agiliway has a strong experience in BI and big data and successfully employs various JavaScript frameworks for development of complex interactive solutions (we have recently shared the insights into the solutions for car tracking and choosing of workout venues and classes with our readers). To meet the challenges of this project, we have built a platform using MS.NET and MS SQL databases to implement API for the back-end and front-end ReactJS application for visualization of data analysis.
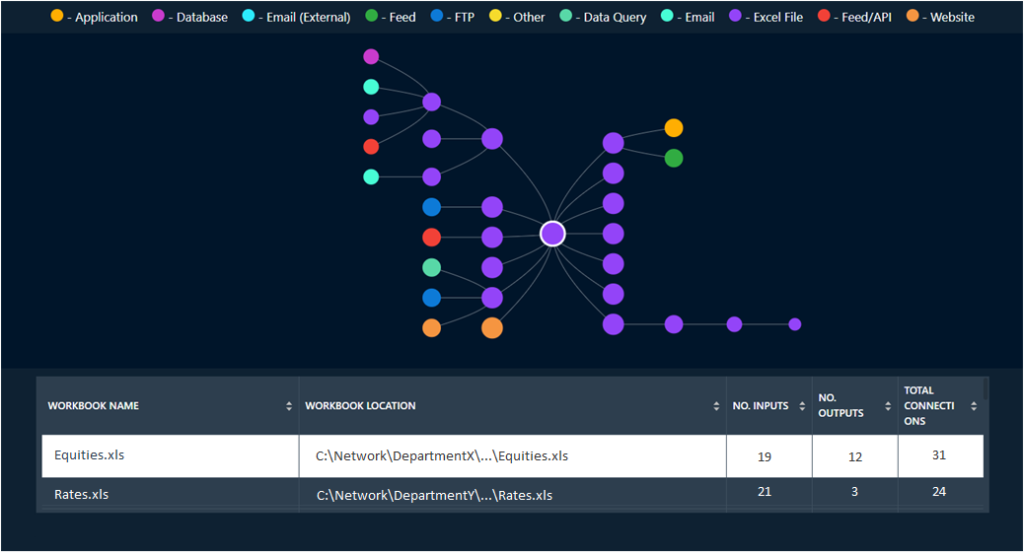
We have used D3.js, a Java Script library for manipulating documents based on data, to allow dynamic and interactive charts. This allows users analyze data from a different point of view or using different parameters simply dragging a particular node on a chart. Specifically, the charts may be used to visualize the following analyses of bid data:
To effectively address security concerns, Agiliway experts have implemented a robust user management and security system, which allows management of user rights and tracking of logs. This way, only authorized users can engage in data mining and the logs show what data they accessed and when.
A well-thought UI effectively complements the visualization and facilitates analysis. For example, when hovering over the node with a mouse, a user can see the details on it pop up directly in the chart. The nodes are visualized using different colors so that users can easily determine the type of information source (e.g. application, database, FTP, email, Excel file, etc.).
Owning a flexible, highly performing, scalable, and secure platform developed by Agiliway, the FinTech company has firmly established on the market and demonstrates a sustainable growth of its revenues. The developed BI data mining solution is successfully employed by many financial institutions to assess the effectiveness of their employees and calculate ROI for their sources of information. Being particularly satisfied with the cooperation, the Fintech company continues using support of our experts to add even more features to the solution. Meanwhile, Agiliway is looking forward to meeting new challenges and sharing details of new exciting cases.
30 | 06 | 2025 June was a big month for tech, with major advancements across space, robotics, AI, energy, and digital services. From reusable …
 25 | 06 | 2025
 Creating compelling presentations has traditionally been a time-consuming and manual process. But what if AI could handle the heavy lifting? …
 23 | 06 | 2025
 Predicting the next pandemic or epidemic highly depends on the existing data and how successfully it is used. Every year, …